Category: Home Assistant
-
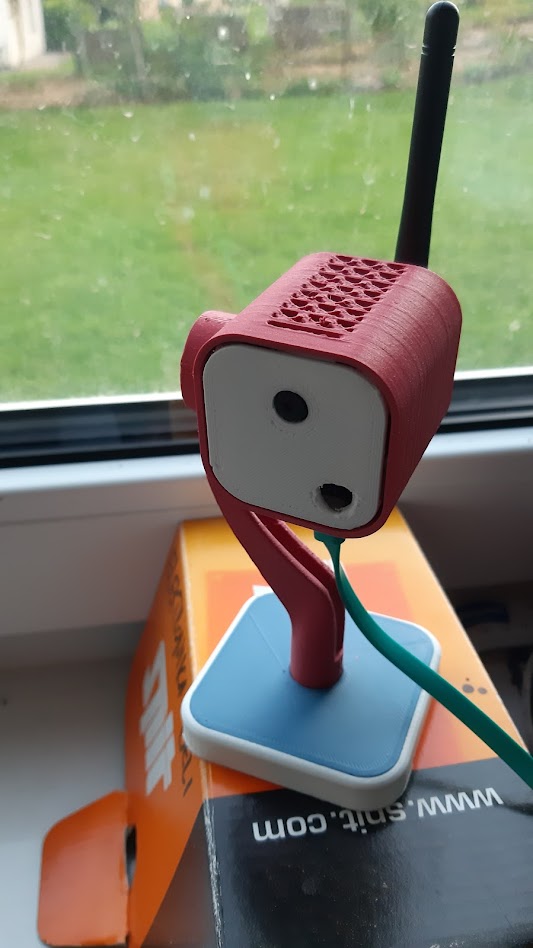
Yet Another ESP32 Webcam
Link to the original blog post with a nice text & pictures layout. The problem: I used an old phone with an Android IP Webcam app to check my driveway, but it stopped working after 3 days. Then I had to reset it – this means going up the ladder every single time. I couldn’t…
-
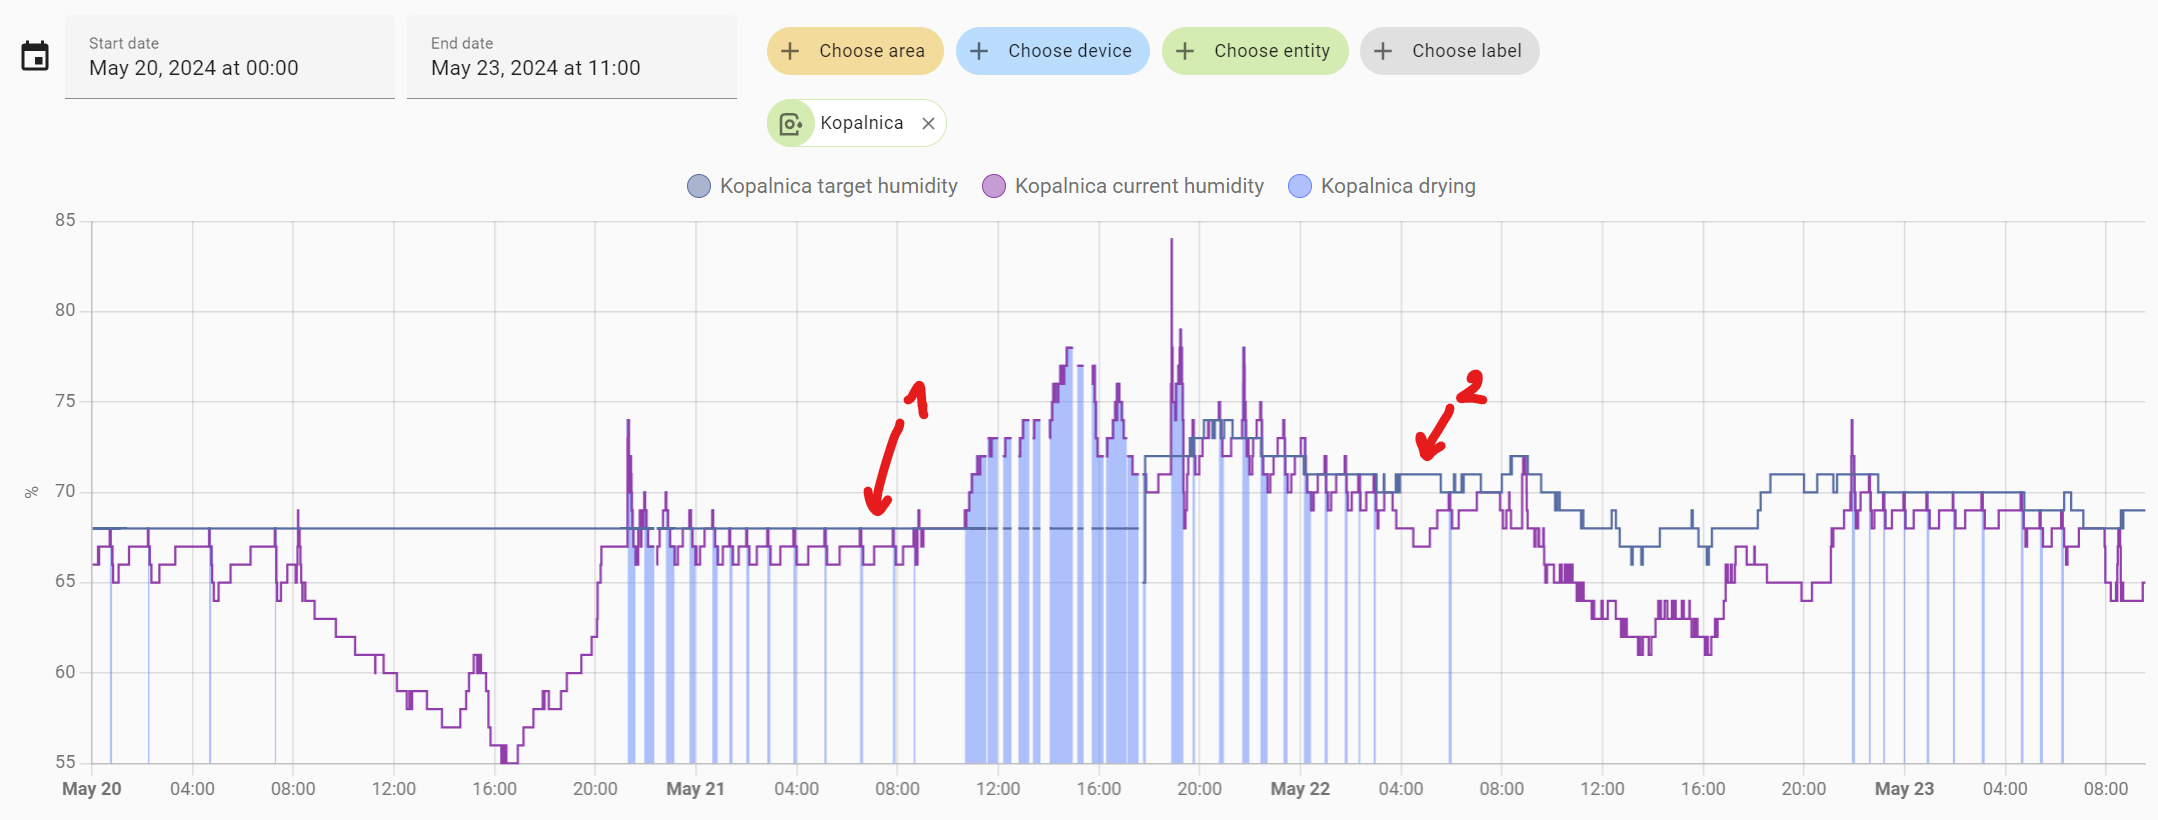
Bathroom dehumidifying using a floating humidity threshold
Blog: Bathroom dehumidifying using two sensors and a floating humidity threshold. Link to the original blog post with a nice text/pictures layout. The problem: The bathroom fan is running too long if it’s raining outside. A year ago I automated the dehumidifying of the bathroom using an extraction fan, Sonoff mini switch, Xiaomi Mi BLE…
-
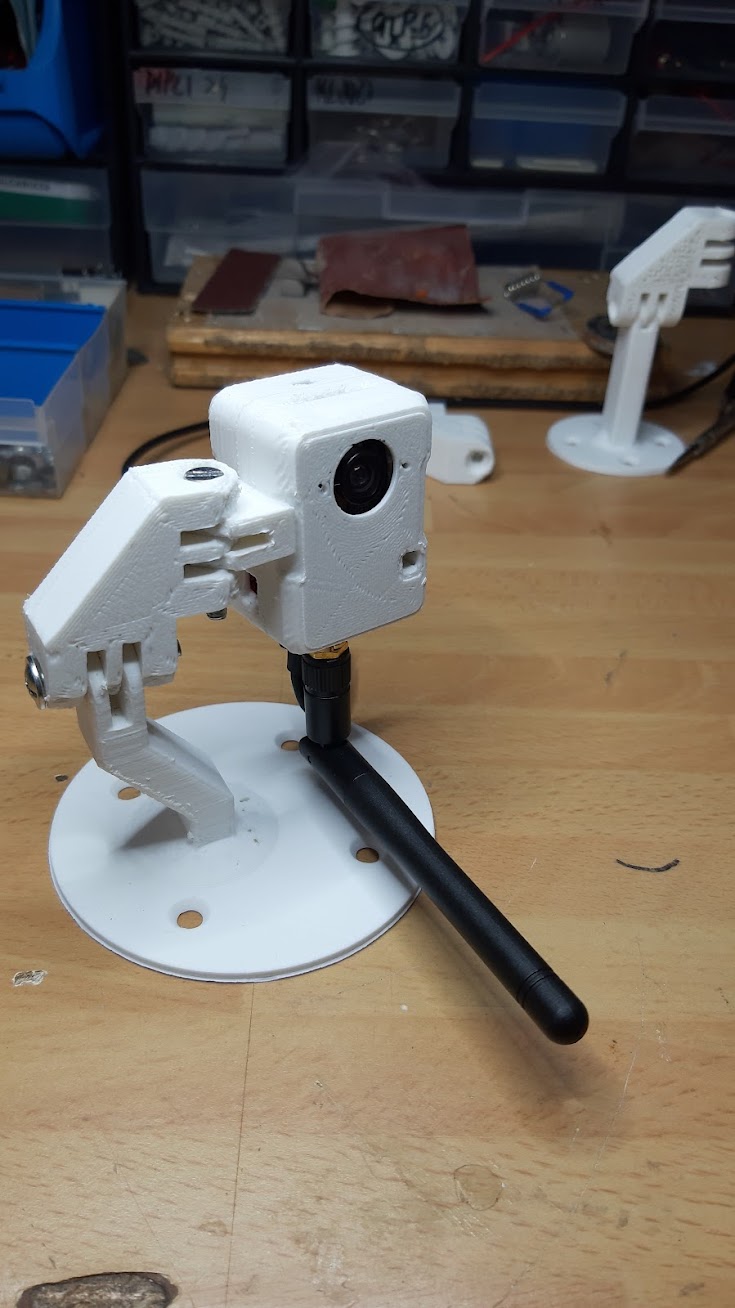
Homemade ESP32 webcam
Homemade ESP32 webcam Link to the original blog post with a nice text/pictures layout. The problem: I want to see what’s happening around the house, especially if the dog is naughty again and digging holes. Actually, there is no problem. I just like to tinker. The solution: A cheap webcam (10€) integrated in #homeassistant. HW…
-
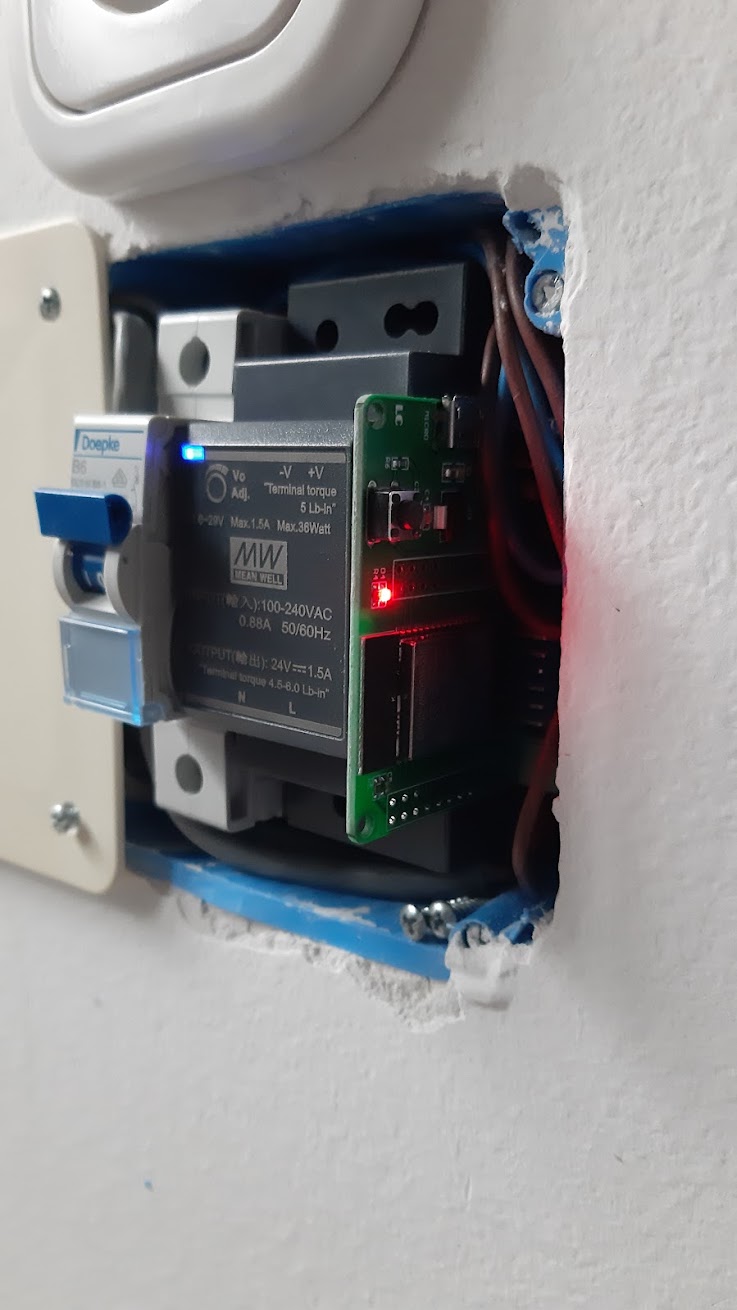
Unlocking the front door using the mobile phone and Home Assistant
Link to the original blog post with a nice text/pictures layout. The problem: The solution: HW parts: SW: The process: Here’s the doodle of the connecting scheme: Here’s the original connecting scheme from Innotherm (door manufacturer), in Slovenian: It was useful because it reveals which power supply is appropriate (Meanwell MW HDR 30-24). 7. Fitted…
-
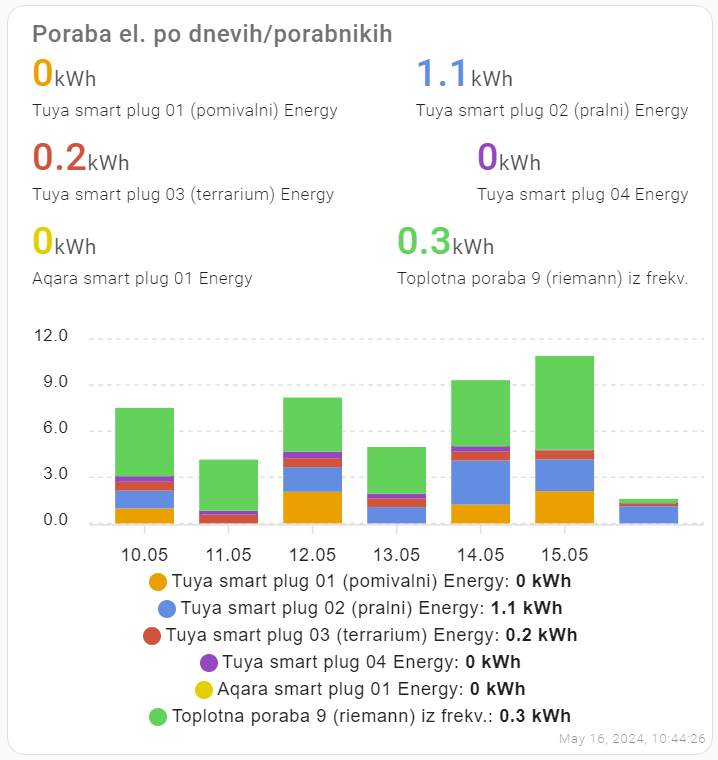
Nice stacked bar charts
#TIL: stacked bar charts in #homeassistant I wanted nice stacked charts to show my energy consumption in Home Assistant. After combining #apexchart code from several sources (1), the result looks like this: The code: I’ve inserted ‘manual card‘ to the dashboardand inserted the yaml code: Before using Apex charts in Home Assistant, install them via…
-
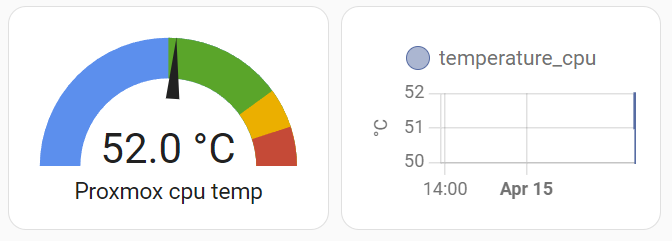
Proxmox server temperature tracking in Home Assistant
(Link to the original blog post with a proper layout) It’s a pity that #Proxmox doesn’t report CPU and other temperatures to #homeassistant. I had several freezes of my old laptop that runs Proxmox due to a stuck CPU fan. I googled a bit and found an elegant solution for temperature reporting: a command_line sensor.…
-
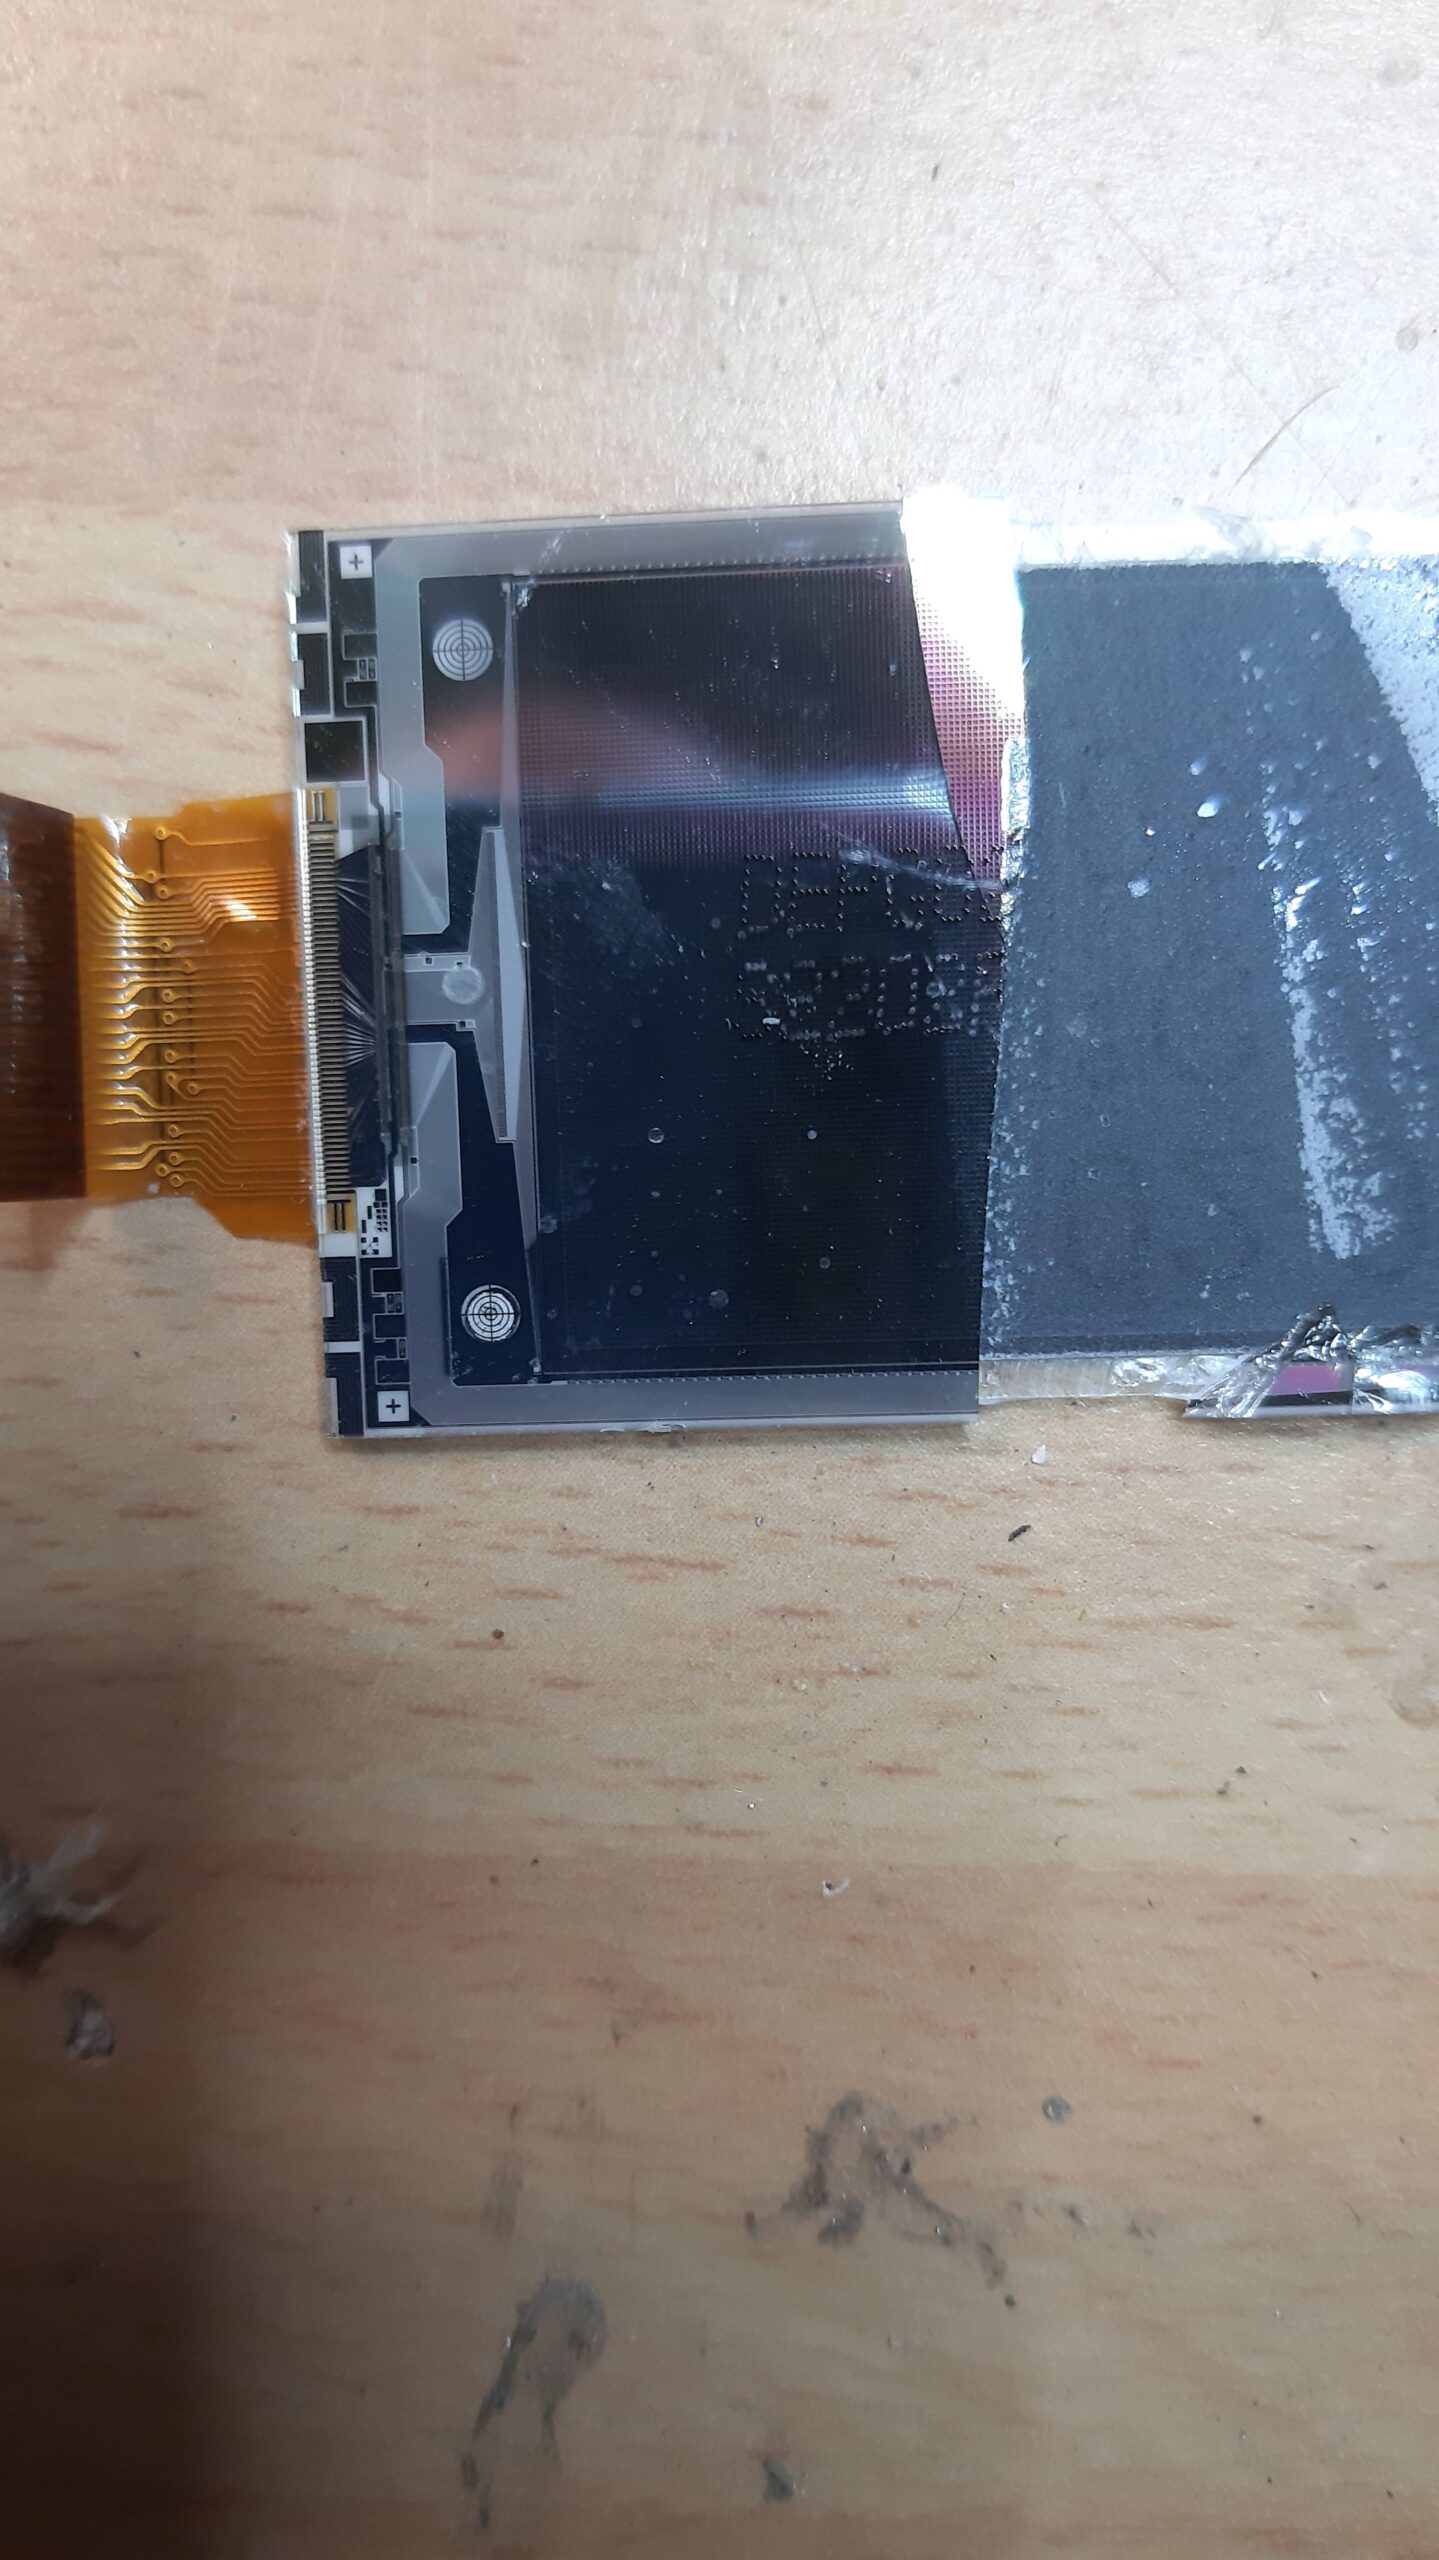
How I killed e-ink display
TL:DR: I don’t know how, but it no longer works. In the previous post, I shared the joy of making #ESP32 #Lilygo T5 2.13′ e-ink display finally work and show some sensor data from #homeassistant. The joy lasted only a week. Yesterday I decided I’d print a nice case for it. I found a great…
-
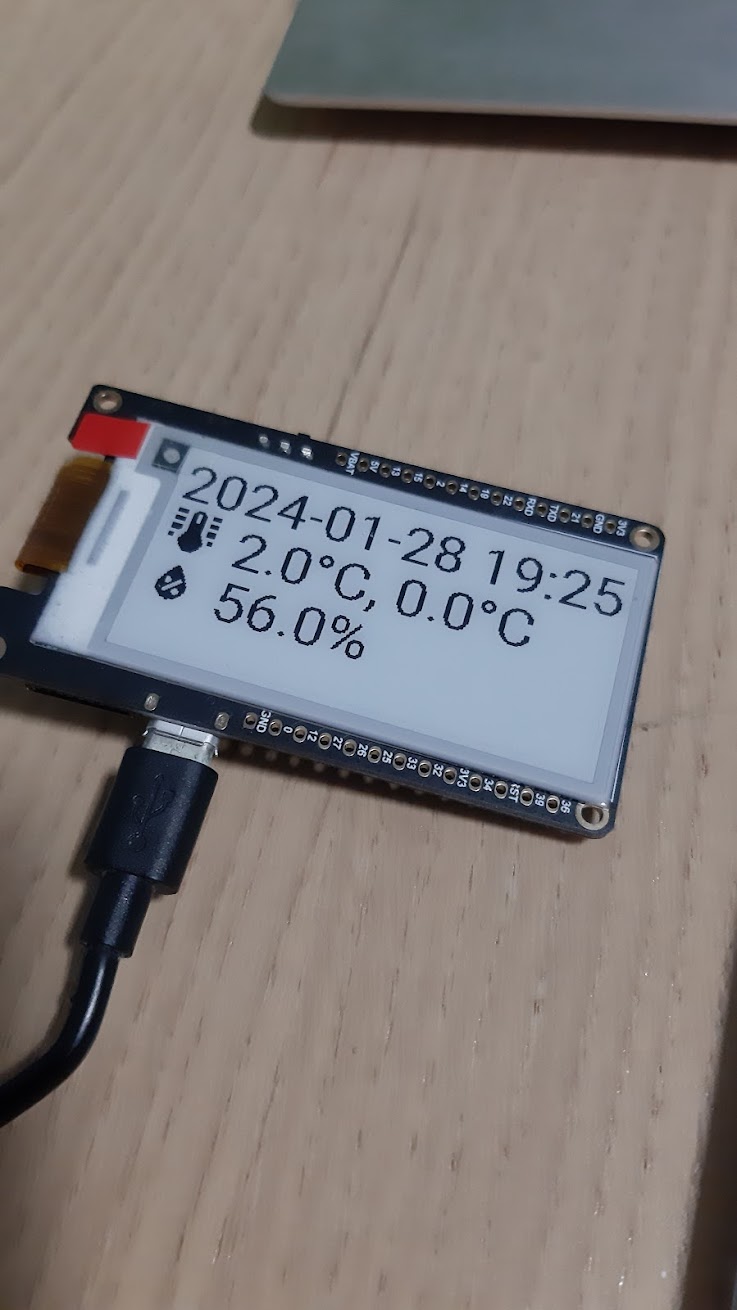
E-ink display showing temperatures from Home Assistant
I had this #esp32 #lilygo board* laying in the drawer for more than 2 years. I tried several times to make the e-ink display work without success.Today I flashed it again with the latest #esphome firmware, stole some code from the web, tinkered for 2 hrs with #yaml and lambdas and whatnot and suddenly… it’s…
-
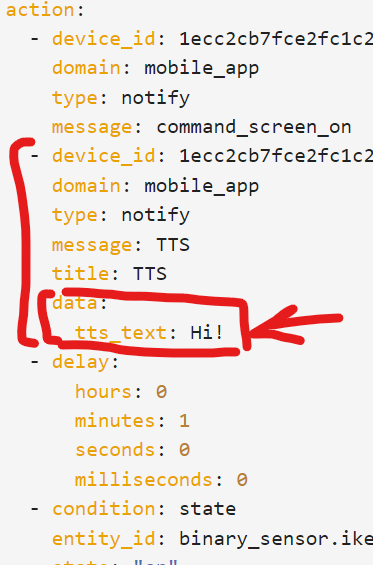
How to make Fire HD tablet talk in Home Assistant
If you have Amazon’s #FireHD (or any other #Android) tablet that shows your #homeassistant dashboard, you can make it talk. I created a new automation (triggered by a motion sensor) which greets me when I approach the tablet: I used the ‘Send notification’ action, chose the tablet and inserted ‘TTS‘ in the message field. Then…
-
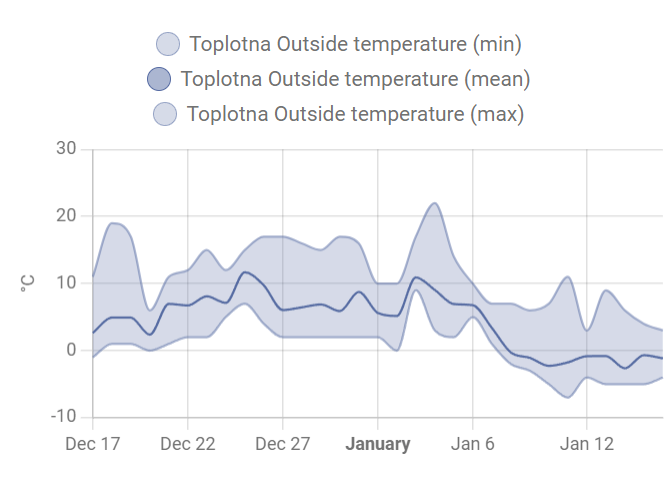
Home Assistant and nice statistics graphs
One of the things that bothered me in #homeassistant for more than a year was the following: I couldn’t figure out why some entities/sensors can draw nice longterm statistics graphs like this (with average, max, min values): and some show only bulky history charts (10 days of data) like this: #til Today I learned I…